
Debugging the Windows kernel on VMware Part One
Numerous methods exist for configuring a Windows virtual machine for debugging purposes, such as through Virtual Box or QEMU. However, this guide will concentrate specifically on the configuration process using VMware. Debugging the Windows Kernel virtually removes the need for two physical computers.
For part one of this article I will cover the setup process involved with debugging the Kernel using WinDbg over a virtual serial port.

WinDbg
It is worth mentioning there are two versions of WinDbg you could use.
The first comes with (Debugging Tools for Windows) that is bundled in the Windows SDK. This version I refer to as the vanilla WinDbg or officially referred to as WinDbg Classic. You can install it standalone by selecting only this option in the SDK installer:

Once installed you can typically find the Debugger in the following folder: C:\Program Files (x86)\Windows Kits\10\Debuggers\x64\ as windbg.exe.

In this guide, we will be using another version, previously known as WinDbg Preview, but now simply referred to as WinDbg. It can be downloaded and installed via the following link: aka.ms/windbg. I remember when this first released the only way you could get it was through the Windows Store which was quite irritating. Never the less once you download the windbg.appinstaller file it looks like this:

The newer WinDbg has a much more user-friendly interface, and I’ve noticed the local view window for variables has become more useful and less buggy. It also introduces a powerful new scripting engine that lets you write your own JavaScript to enhance the debugging experience, simplifying complex tasks. I’ll share some of my scripts on GitHub later, which you might find useful.
Required Tools
When I refer to VMWare I’m talking about VMWare Workstation. You will need this installed with a fresh copy of Windows 10 for this guide.
You should also have the newer WinDbg installed on your system.
VM Configuration
For your specific VM, the first step is to add a virtual serial port. You can do this by going into the settings of the Virtual Machine, and under hardware, there will be an option to add a serial port:
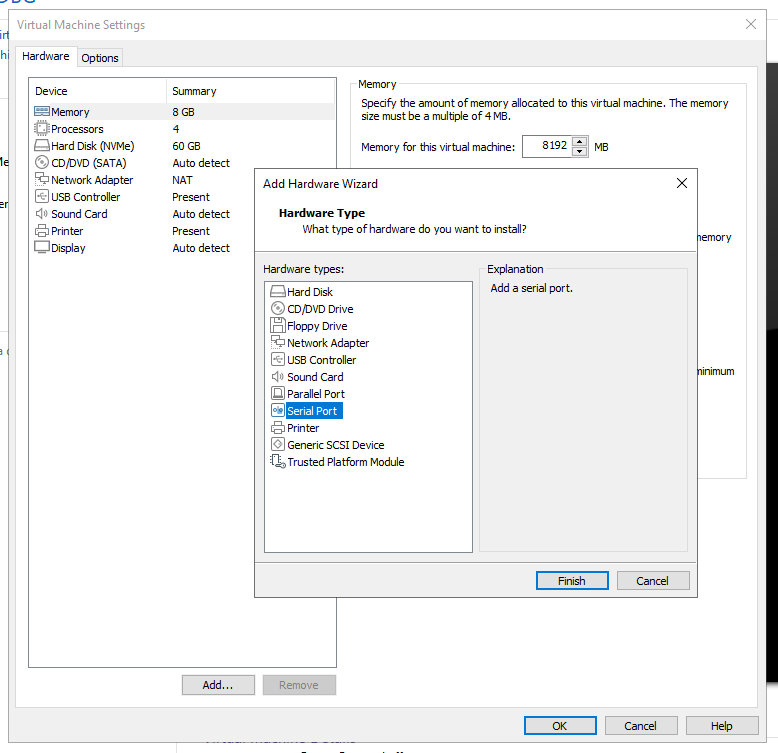
Once it’s added, the entry will appear in the hardware list. If you are curious as to why it’s called Serial Port 2 and not 1, that is because the default printer hardware occupies the first port. You can either remove the Printer or simply opt to use Port 2.
Configure it as the following:

The important part here is making sure you remember the name of the named Pipe you have set \\.\pipe\dbg_port and the checkbox at the bottom that says Yield CPU on poll.
Once you have completed these steps you can power on the VM for the next part.
Windows 10 (Guest) Configuration
The first thing you need to do is make sure Secure Boot is not enabled in the target VM. There is method to debug the kernel with Secure Boot enabled however for part one of this guide using a serial port we will assume you have it turned off.
You can either use BCDEdit or use the msconfig utility to enable debugging.
If you use bcdedit, in an elevated command prompt you will need to execute the following:
bcdedit /debug onbcdedit /dbgsettings serial debugport:2 baudrate:115200
Through the UI is a more user friendly approach:
Use the shortcut key
Windows+Rto open the run dialog and typemsconfig. Hit Enter to bring up the System Configuration Window.Click the Boot tab, select
Advanced options...then tickDebug. Set Debug Port toCOM2and the Baud Rate to115200. It should end up looking like this:
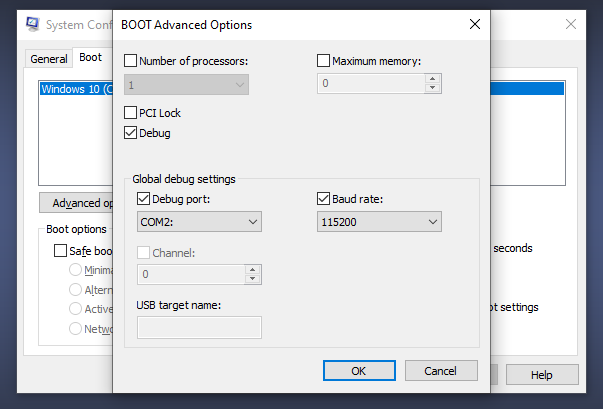
Hit Ok, Apply then Ok again.
It will ask you to Restart to apply changes. You may do so.
WinDbg Configuration
Now that we have configured the VM settings and the guest OS we move on to setting up WinDbg to now attach to that VM using the configured settings.
- Open WinDbg and select Start Debugging
- Select Attach to kernel, and select COM
- Set the settings as the following, at this point this is self explanatory:
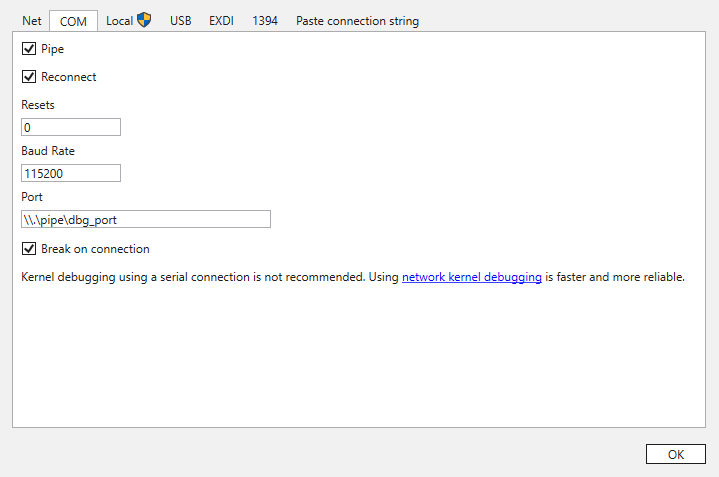
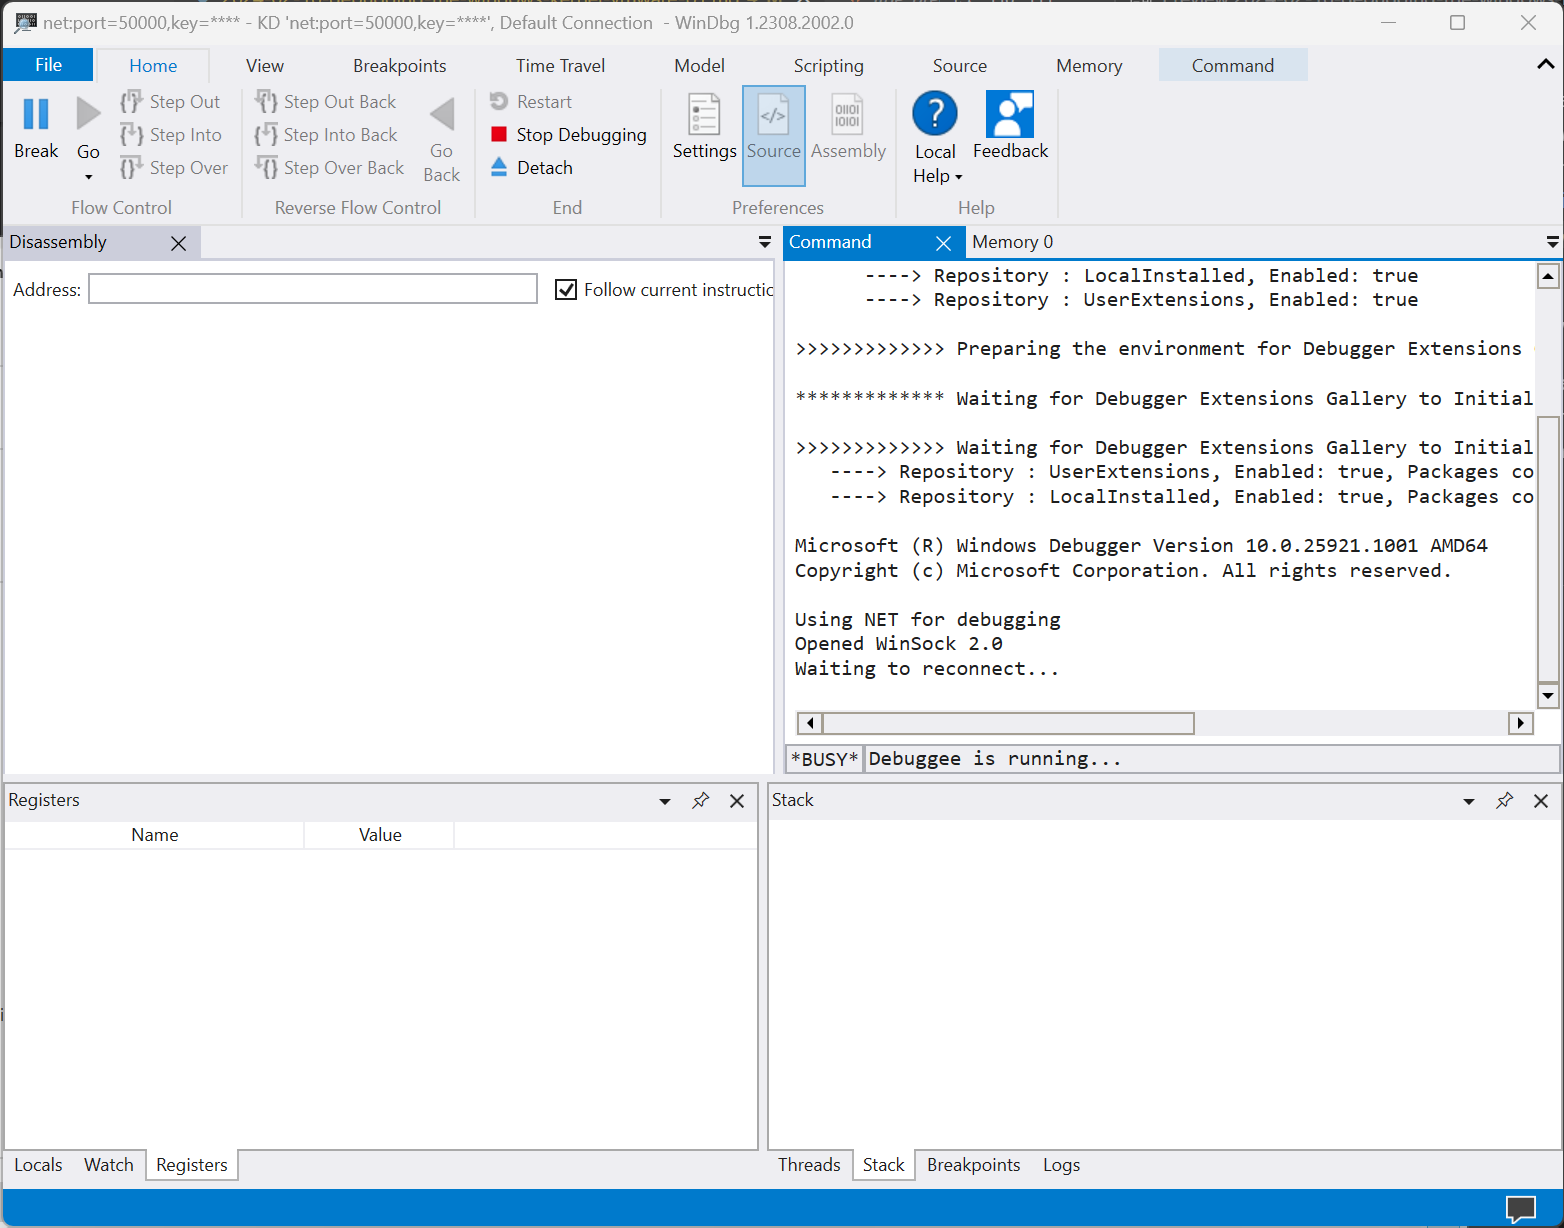
- Hit Ok and it should now attach to your Windows running in the VM.

Debug Symbols
It is important that you have setup the correct symbol path to resolve symbols of kernel and usermode modules.
- In Windbg go to
File->Settings->Debugging Settings - Under
Debugging pathsset the Symbol path.
You can set your symbol path to for example:
srv*
SRV*C:\SYMBOLS*http://msdl.microsoft.com/download/symbols
which will take advantage of the Microsoft public symbol server to automatically download the necessary symbols when WinDbg requires them.
The C:\SYMBOLS path mentioned above serves as the local cache for storing the downloaded PDB files. Microsoft specifies that if the local symbol cache location is omitted, the sym subdirectory within the debugger’s installation directory is utilized as the default storage location.
Some useful commands you might find helpful when troubleshooting symbol display issues in WinDbg include .symfix followed by .reload /f. Additionally, issuing !sym noisy beforehand can provide verbose information about WinDbg’s actions while loading the required symbols, aiding in diagnostics. These commands are valuable tools for troubleshooting. Remember, however, to execute !sym quiet once everything is resolved, to minimize unnecessary clutter in the output.
Limitations of Serial Port Debugging
While debugging the Windows kernel using a virtual serial port and WinDbg provides a robust foundation for understanding the inner workings of the system, it’s not without its limitations. This method, although effective for initial setups, can be slower and more cumbersome compared to modern techniques. Serial port communication inherently lacks the speed and flexibility offered by network-based debugging solutions.
I found this way of debugging bearable but really sluggish. Additionally, the reliance on specific port configurations might limit the debugger’s accessibility and scalability, especially in environments where resources are dynamically allocated.
In Part Two of this series, we’ll explore the advantages of using KDNET for kernel debugging over the network. This approach not only simplifies the setup process but also significantly enhances debugging efficiency and flexibility, allowing for a more seamless and productive development experience.